What Languages Do Public Library Collections Speak?
Originally published November 24, 2014 in hangingtogether.org from OCLC Research
In May of 2014, Slate published a series of maps illustrating the languages other than English spoken in each of the fifty US states. In nearly every state, the most commonly spoken non-English language was Spanish. But when Spanish is excluded as well as English, a much more diverse – and sometimes surprising – landscape of languages is revealed, including Tagalog in California, Vietnamese in Oklahoma, and Portuguese in Massachusetts.
Public library collections often reflect the attributes and interests of the communities in which they are embedded. So we might expect that public library collections in a given state will include relatively high quantities of materials published in the languages most commonly spoken by residents of the state. We can put this hypothesis to the test by examining data from WorldCat, the world’s largest bibliographic database.
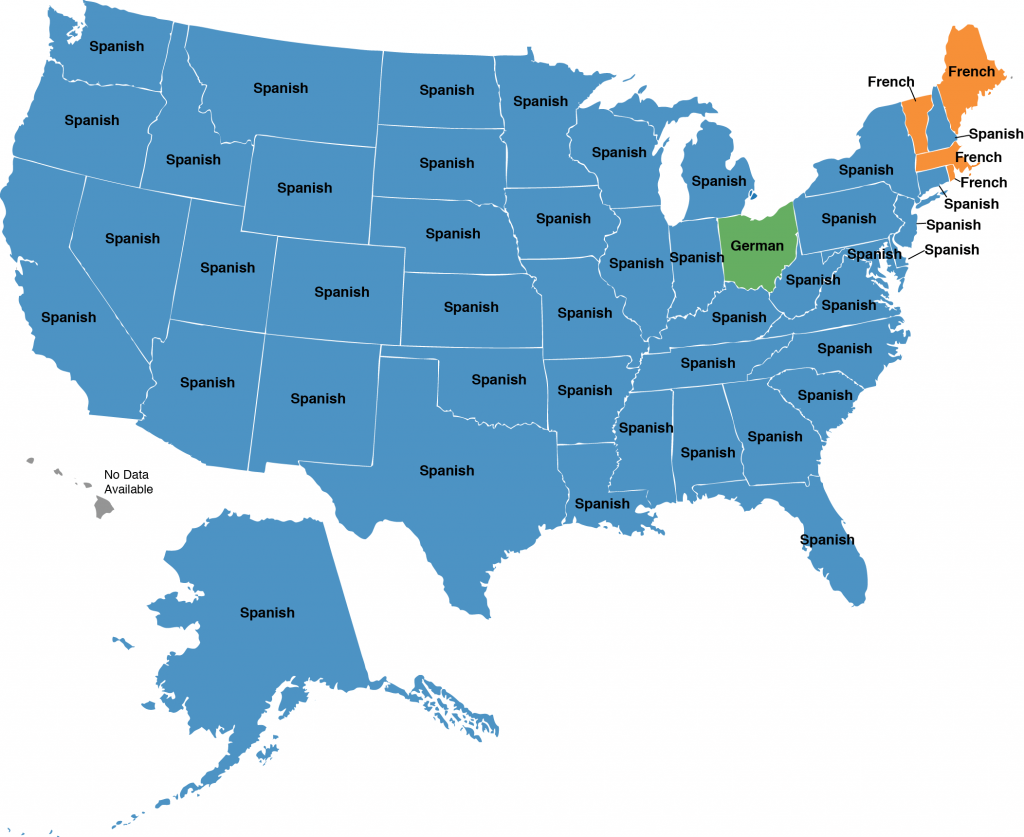
WorldCat contains bibliographic data on more than 300 million titles held by thousands of libraries worldwide. For our purposes, we can filter WorldCat down to the materials held by US public libraries, which can then be divided into fifty “buckets” representing the materials held by public libraries in each state. By examining the contents of each bucket, we can determine the most common language other than English found within the collections of public libraries in each state:
MAP 1: Most common language other than English found in public library collections, by state
As with the Slate findings regarding spoken languages, we find that in nearly every state, the most common non-English language in public library collections is Spanish. There are exceptions: French is the most common non-English language in public library collections in Massachusetts, Maine, Rhode Island, and Vermont, while German prevails in Ohio. The results for Maine and Vermont complement Slate’s finding that French is the most commonly spoken non-English language in those states – probably a consequence of Maine and Vermont’s shared borders with French-speaking Canada. The prominence of German-language materials in Ohio public libraries correlates with the fact that Ohio’s largest ancestry group is German, accounting for more than a quarter of the state’s population.
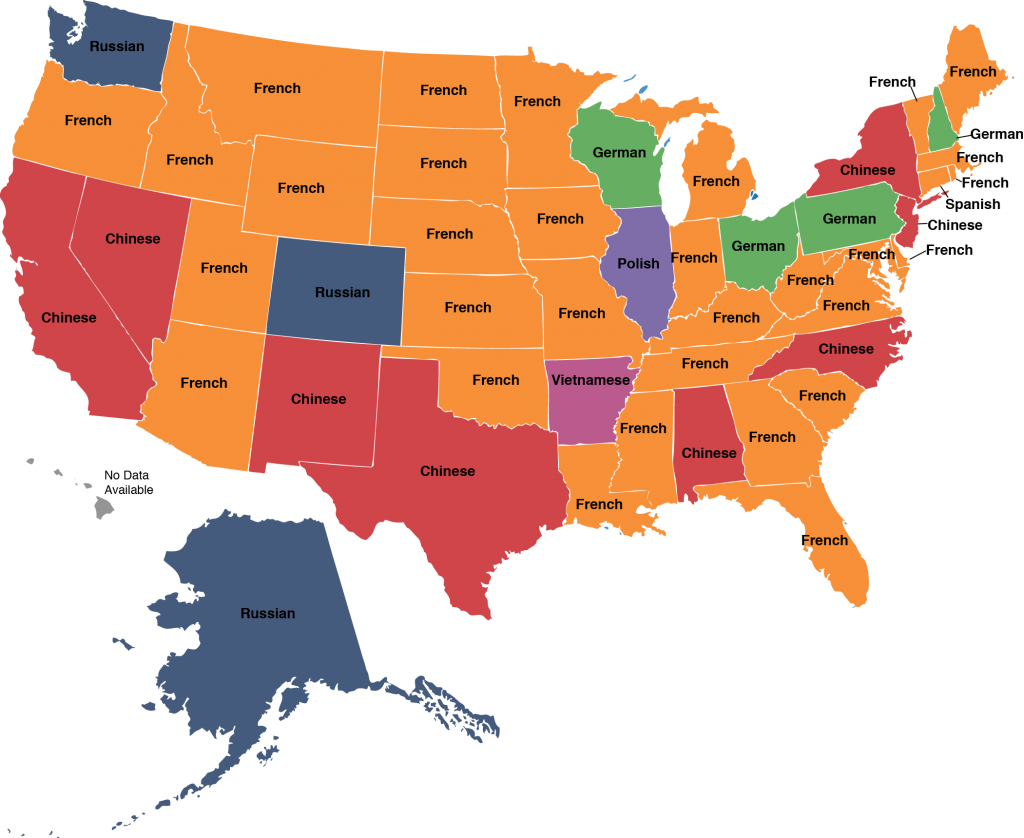
Following Slate’s example, we can look for more diverse language patterns by identifying the most common language other than Englishand Spanish in each state’s public library collections:
MAP 2: Most common language other than English and Spanish found in public library collections, by state
Excluding both English- and Spanish-language materials reveals a more diverse distribution of languages across the states. But only a bit more diverse: French now predominates, representing the most common language other than English and Spanish in public library collections in 32 of the 50 states. Moreover, we find only limited correlation with Slate’s findings regarding spoken languages. In some states, the most common non-English, non-Spanish spoken language does match the most common non-English, non-Spanish language in public library collections – for example, Polish in Illinois; Chinese in New York, and German in Wisconsin. But only about a quarter of the states (12) match in this way; the majority do not. Why is this so? Perhaps materials published in certain languages have low availability in the US, are costly to acquire, or both. Maybe other priorities drive collecting activity in non-English materials – for example, a need to collect materials in languages that are commonly taught in primary, secondary, and post-secondary education, such as French, Spanish, or German.
Or perhaps a ranking of languages by simple counts of materials is not the right metric. Another way to assess if a state’s public libraries tailor their collections to the languages commonly spoken by state residents is to compare collections across states. If a language is commonly spoken among residents of a particular state, we might expect that public libraries in that state will collect more materials in that language compared to other states, even if the sum total of that collecting activity is not sufficient to rank the language among the state’s most commonly collected languages (for reasons such as those mentioned above). And indeed, for a handful of states, this metric works well: for example, the most commonly spoken language in Florida after English and Spanish is French Creole, which ranks as the 38th most common language collected by public libraries in the state. But Florida ranks first among all states in the total number of French Creole-language materials held by public libraries.
But here we run into another problem: the great disparity in size, population, and ultimately, number of public libraries, across the states. While a state’s public libraries may collect heavily in a particular language relative to other languages, this may not be enough to earn a high national ranking in terms of the raw number of materials collected in that language. A large, populous state, by sheer weight of numbers, may eclipse a small state’s collecting activity in a particular language, even if the large state’s holdings in the language are proportionately less compared to the smaller state. For example, California – the largest state in the US by population – ranks first in total public library holdings of Tagalog-language materials; Tagalog is California’s most commonly spoken language after English and Spanish. But surveying the languages appearing in Map 2 (that is, those that are the most commonly spoken language other than English and Spanish in at least one state), it turns out that California also ranks first in total public library holdings for Arabic, Chinese, Dakota, French, Italian, Korean, Portuguese, Russian, and Vietnamese.
To control for this “large state problem,” we can abandon absolute totals as a benchmark, and instead compare the ranking of a particular language in the collections of a state’s public libraries to the average ranking for that language across all states (more specifically, those states that have public library holdings in that language). We would expect that states with a significant population speaking the language in question would have a state-wide ranking for that language that exceeds the national average. For example, Vietnamese is the most commonly spoken language in Texas other than English and Spanish. Vietnamese ranks fourth (by total number of materials) among all languages appearing in Texas public library collections; the average ranking for Vietnamese across all states that have collected materials in that language is thirteen. As we noted above, California has the most Vietnamese-language materials in its public library collections, but Vietnamese ranks only eighth in that state.
Map 3 shows the comparison of the state-wide ranking with the national average for the most commonly spoken language other than English and Spanish in each state:
MAP 3: Comparison of state-wide ranking with national average for most commonly spoken language other than English and Spanish
Now it appears we have stronger evidence that public libraries tend to collect heavily in languages commonly spoken by state residents. In thirty-eight states (colored green), the state-wide ranking of the most commonly spoken language other than English and Spanish in public library collections exceeds – often substantially – the average ranking for that language across all states. For example, the most commonly spoken non-English, non-Spanish language in Alaska – Yupik – is only the 10thmost common language found in the collections of Alaska’s public libraries. However, this ranking is well above the national average for Yupik (182nd). In other words, Yupik is considerably more prominent in the materials held by Alaskan public libraries than in the nation at large – in the same way that Yupik is relatively more common as a spoken language in Alaska than elsewhere.
As Map 3 shows, six states (colored orange) exhibit a ranking equal to the national average; in all of these cases the language in question is French or German, languages that tend to be highly collected everywhere (the average ranking for French is four, and for German, five). Five states (colored red) exhibit a ranking that is below the national average; in four of the five cases, the state ranking is only one notch below the national average.
The high correlation between languages commonly spoken in a state, and the languages commonly found within that state’s public library collections suggests that public libraries are not homogenous, but in many ways reflect the characteristics and interests of local communities. It also highlights the important service public libraries provide in facilitating information access to community members who may not speak or read English fluently. Finally, public libraries’ collecting activity across a wide range of non-English language materials suggests the importance of these collections in the context of the broader system-wide library resource. Some non-English language materials in public library collections – perhaps the French Creole-language materials in Florida’s public libraries, or the Yupik-language materials in Alaska’s public libraries – could be rare and potentially valuable items that are not readily available in other parts of the country.
Visit your local public library … you may find some unexpected languages on the shelf.
Acknowledgement: Thanks to OCLC Research colleague JD Shipengrover for creating the maps.
Note on data: Data used in this analysis represent public library collections as they are cataloged in WorldCat. Data is current as of July 2013. Reported results may be impacted by WorldCat’s coverage of public libraries in a particular state.


